(Updated: ) · Admin · 9 min read
Data Telemetry on the Edge: Machine Learning and IoT Architecture Pipelines from URIIS 2026
A deep technical post-mortem of the computer vision, geospatial big data, and bi-directional IoT telemetry frameworks demonstrated at the URIIS 2026 Borneo Leg. Discover how to build production-ready edge systems that scale.
Live Machine Learning Validation Matrix & Telemetry Stream Optimizer
Simulate edge dataset processing, fine-tune your model inference thresholds, and optimize confidence filters in real time to calculate resulting precision, recall, and frame-processing latency budgets:
Edge Telemetry & ML Optimizer
Fine-tune machine learning confidence filters and image processing parameters to optimize frame latency and prediction accuracy metrics in real time.
Technical Overview: The Edge-to-Cloud Latency Disconnect
When executing smart industrial software, relying on monolithic cloud processing engines for real-time sensor metrics or high-resolution spatial datasets introduces critical latency bottlenecks. For advanced production frameworks—like those evaluated during the URIIS 2026 Series 7 Roadshow at i-CATS University College—success is determined entirely by execution velocity at the local node level.
Academic research groups consistently generate powerful algorithmic models in controlled environments. However, deploying those models into field operations requires a complete architecture shift from high-level mathematical scripts to low-overhead, hardware-optimized runtime execution.
This engineering post-mortem breaks down the deployment mechanics, matrix optimizations, and backend data paths required to build stable computer vision and bi-directional IoT systems that match the benchmarks set during the summit.
1. Computer Vision Pipelines: High-Precision Aerial Telemetry
Among the digital transformation models showcased at the summit, the UNIMAS Durian Tree Crown Data Acquisition research system demonstrated the absolute precision required for modern agricultural computer vision.
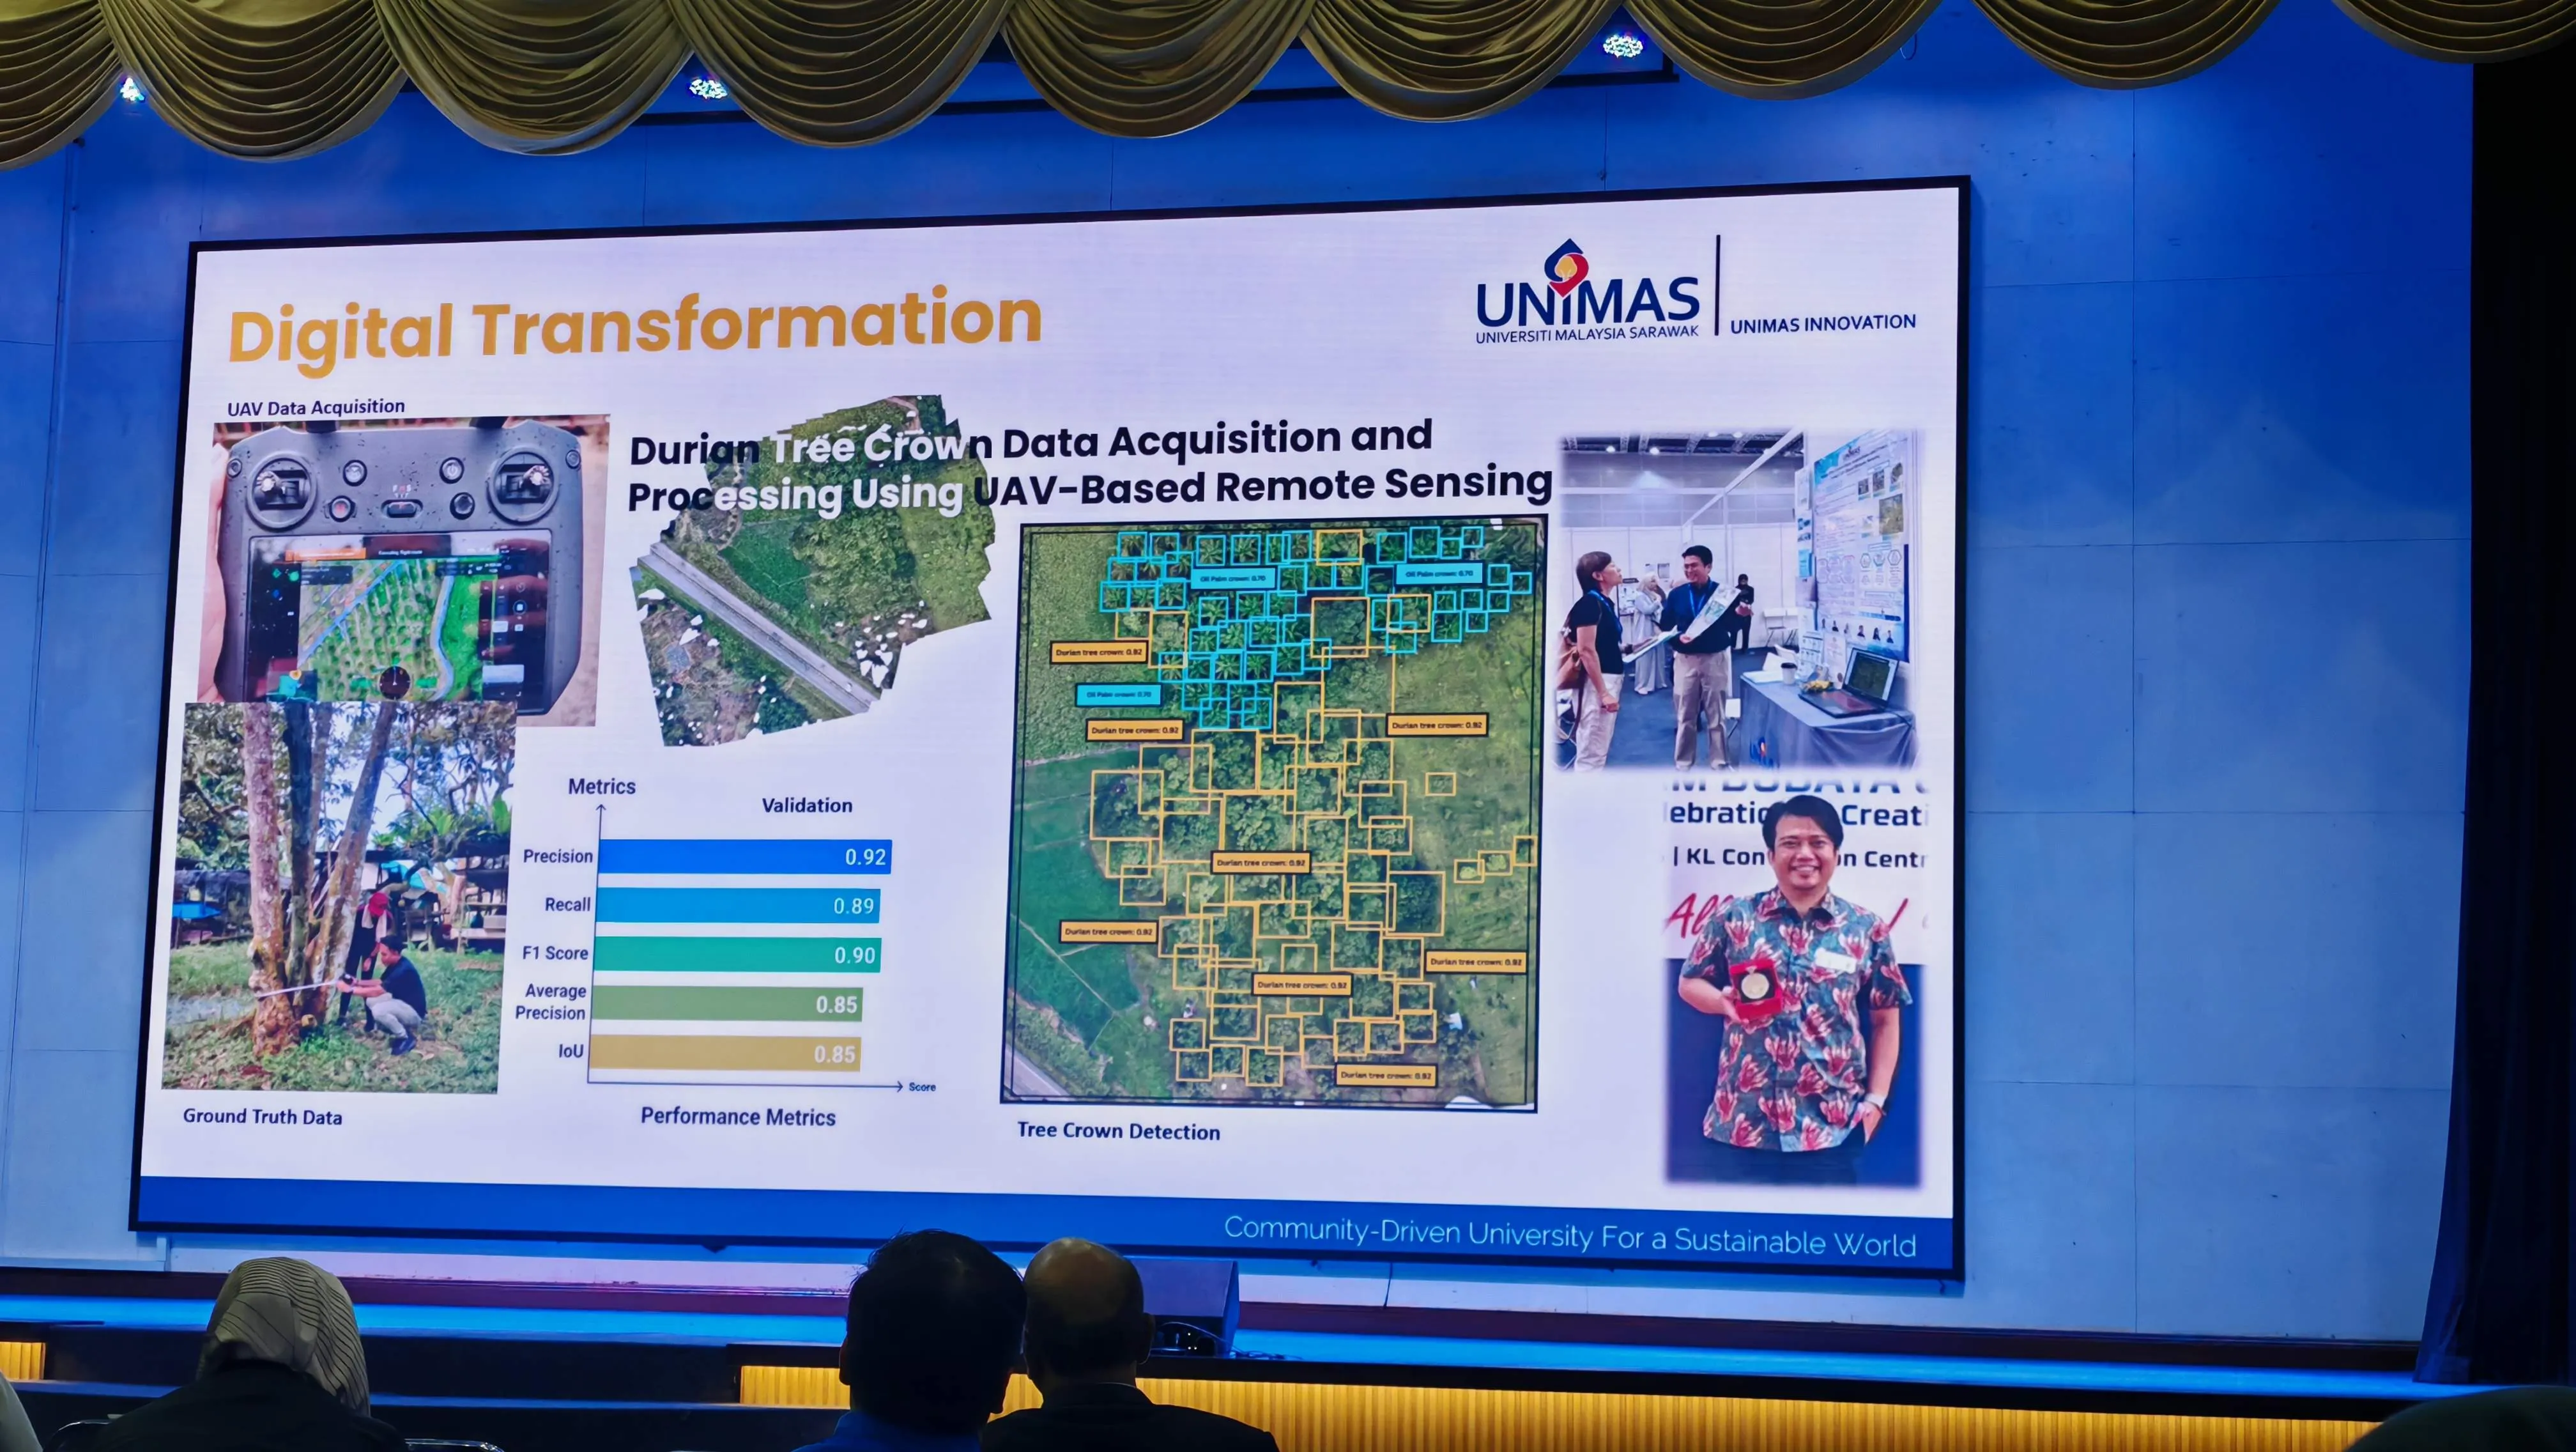
The system achieved an outstanding validation profile under deep remote sensing constraints: 0.92 Precision, 0.89 Recall, and a 0.90 F1-Score.
Production Optimization Strategy
To deploy a model with this level of detail onto real-world web or mobile application dashboards without overloading the client device, the engineering stack must decouple image acquisition from inference loops:
- Quantization and Compilation: Raw PyTorch or TensorFlow weights are too heavy for low-latency systems. Architects must quantize models down to FP16 or INT8 precision layers and compile them to run on native frameworks like ONNX Runtime or TensorRT.
- Chunked Spatial Tile Processing: High-resolution orthomosaic drone frames are divided programmatically into compressed, overlapping spatial tiles ($512 \times 512$ pixels) to maintain an accurate Intersection over Union (IoU) bounding-box metric without hitting memory limits.
- Async Batch Processing Loops: Instead of running synchronous HTTP requests, incoming asset streams are funneled through an asynchronous worker queue (such as Celery backed by Redis memory stores) to run inferences in parallel while maintaining a smooth 60fps UI paint layer on the dashboard tracking map.
2. Geospatial Architecture: Scaling Big Data Stacks
Processing localized tracking metrics across vast territories—as seen in the UNIMAS Big Data Analytic for Sarawak Biodiversity Distribution Data platform—demands database designs engineered for multi-million row spatial lookups.
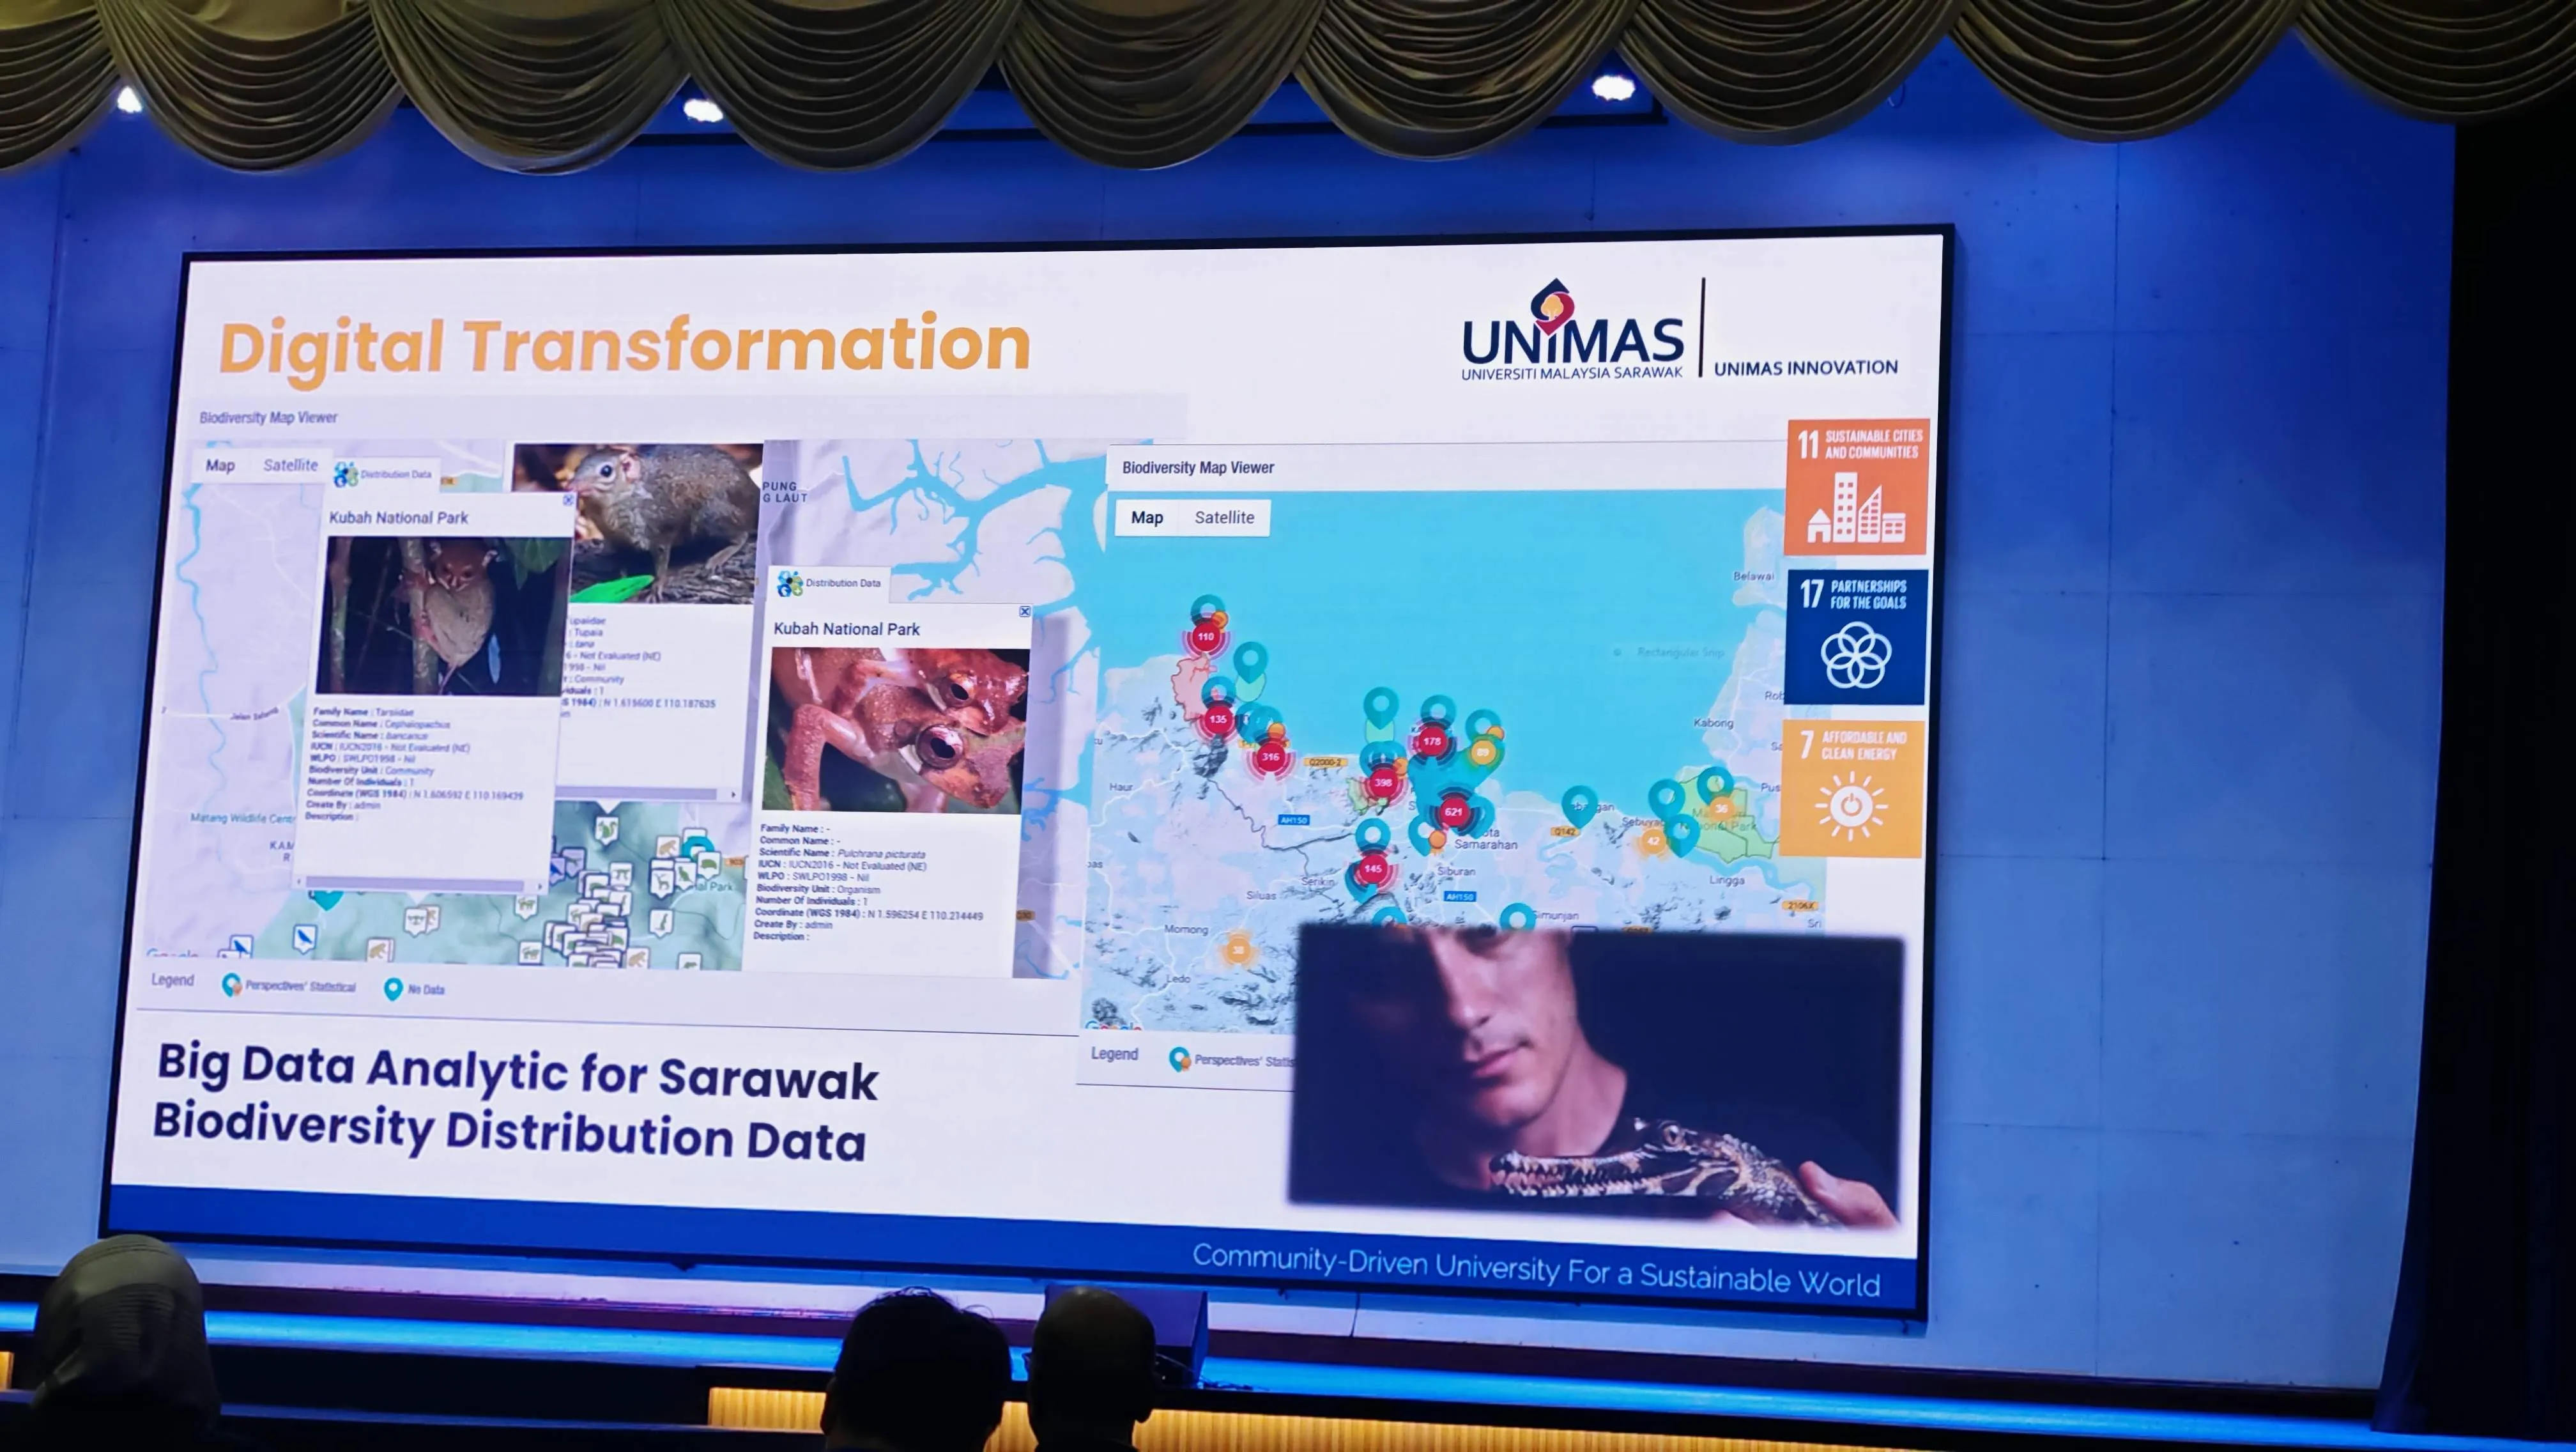
Building the Spatial Database Layer
When building web applications that map high-density, real-time geographic data points (such as the tracking systems used for vulnerable species distributions in Kubah National Park), the system architect must eliminate spatial database bottlenecks:
- Database Sharding & Partitioning: Use relational spatial tables (like PostgreSQL with PostGIS extensions) partitioned systematically by geographic grid zones or administrative boundaries.
- R-Tree Indexing Pipelines: Every incoming coordinate array is passed through spatial indexes (GIST) to group geographic nodes into nested boundary boxes, reducing query times from full-table scans to microsecond lookups.
- Dynamic Vector Tile Streaming: Do not deliver raw, heavy GeoJSON objects to client browsers. The backend server acts as a rapid tile rendering pipeline, converting raw geometry variables on-the-fly into Mapbox Vector Tiles (
.pbf). This architecture ensures only the data within the user’s immediate viewport zoom level is fetched over the network, keeping initial page weight low.
3. Bi-Directional IoT Pipelines: Real-Time Control Hardware
The summit moved completely past static monitoring concepts with the introduction of the IoT-Based System for Micro Organic Farming, natively funded by the Ministry of Education, Science and Technological Research Sarawak.
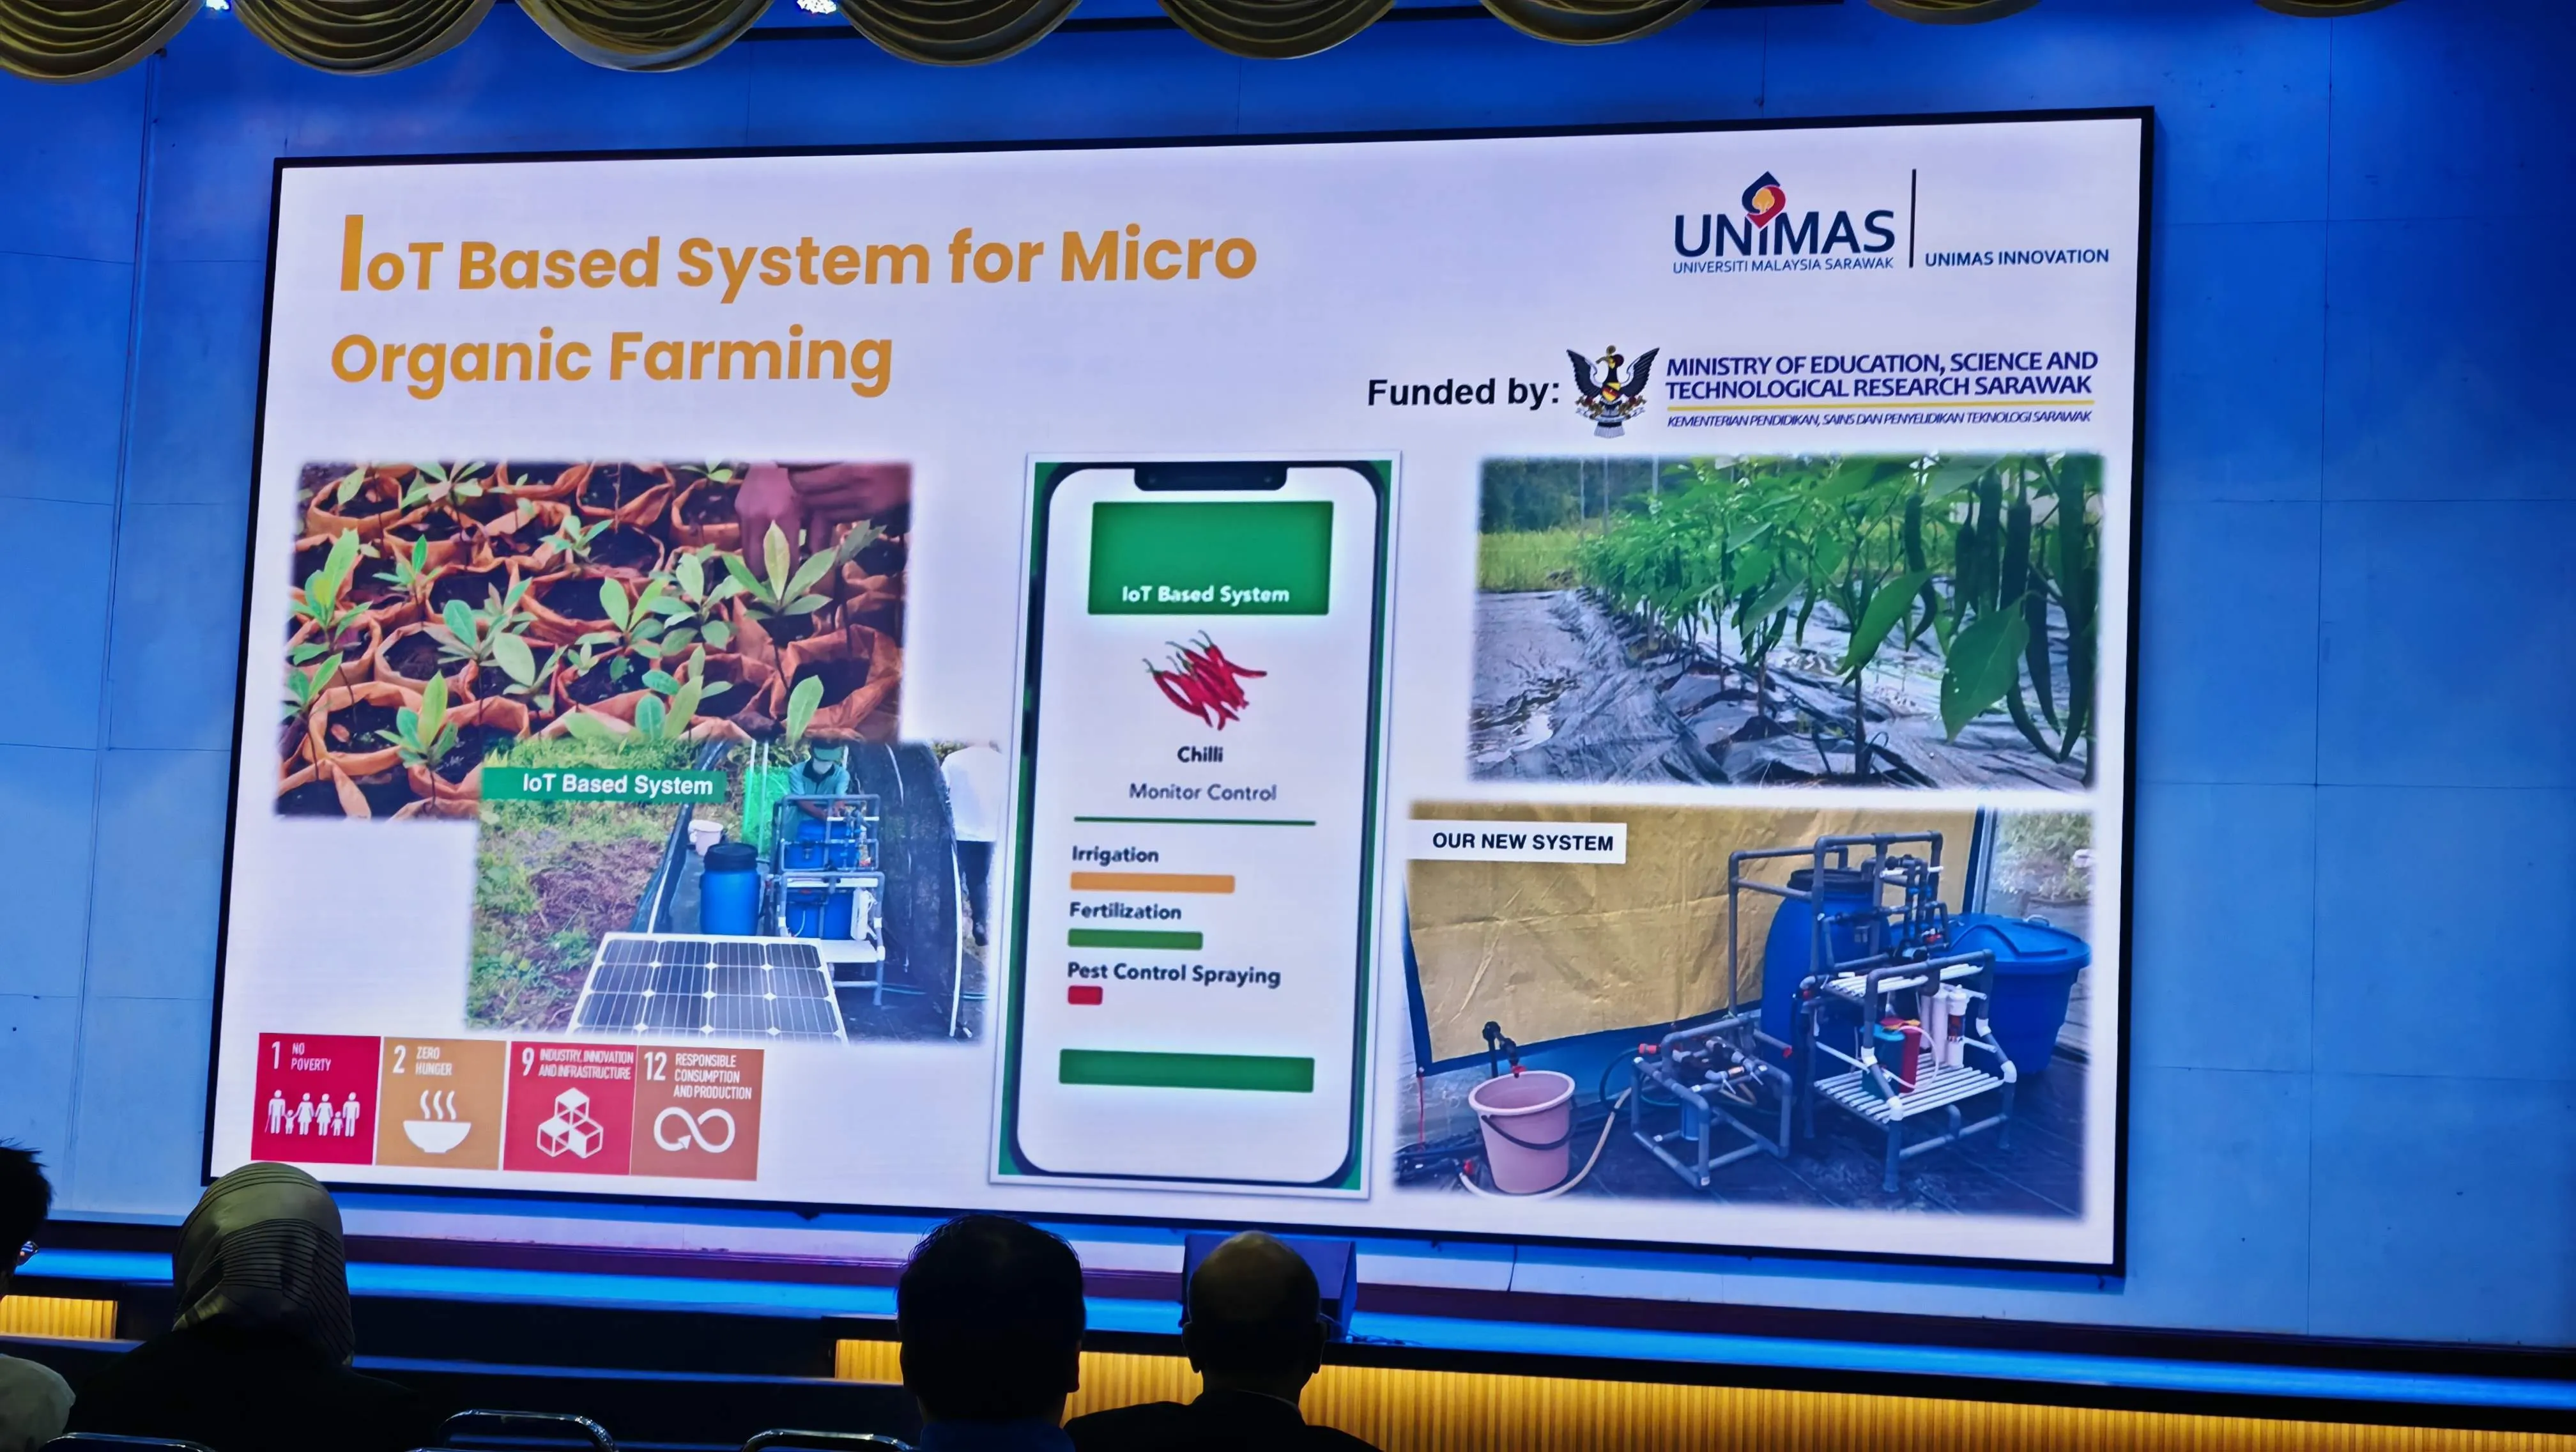
This operational blueprint maps out a multi-tiered automation system managing critical physical layers: Irrigation, Fertilization, and Pest Control Spraying.
The Zero-Management Integration Blueprint
To commercialize a hardware control loop safely, the system must establish an invisible, highly available backend shield that process telemetry data while actively neutralizing network friction:
+------------------------+      MQTT / TLS Bus      +--------------------------+
|  Edge Hardware Nodes   | <======================> |   Core Message Broker    |
|  (Irrigation, Pumps)   |  Low-Overhead Telemetry  | (EMQX/Mosquitto Cluster) |
+------------------------+                          +--------------------------+
            |
            | Bi-Directional
            | gRPC Pipeline
            v
+------------------------+      <==============>       Data Analytics &
| Automated Rule Engine  |                             ML Feedback Loop
| & Telemetry Database   |
+------------------------+- Low-Overhead Middleware Transport: Field hardware clusters communicate with a highly scalable message broker (such as an EMQX cluster) via MQTT over TLS. This design maintains ultra-lightweight data payloads, preserving network stability even on unstable mobile connections.
- Bi-Directional Command Pipelines: State changes triggered on the client-facing control dashboard are pushed instantly to the edge hardware layers through streaming gRPC pipelines. This architecture achieves sub-100ms reaction times for emergency valve or pump terminations.
- Continuous System Telemetry Logging: Every sensor read, automated mix adjustment, and physical spraying signal is written directly to a high-speed time-series database (like InfluxDB or TimescaleDB). This creates an immutable data trail, providing the exact auditing evidence required by state validation boards and grant compliance reviewers.
4. Institutional Technical Infrastructure
These advanced software structures do not run in a vacuum. They are fully aligned with the massive regional infrastructure roadmaps established by Sarawak’s leading research institutes.
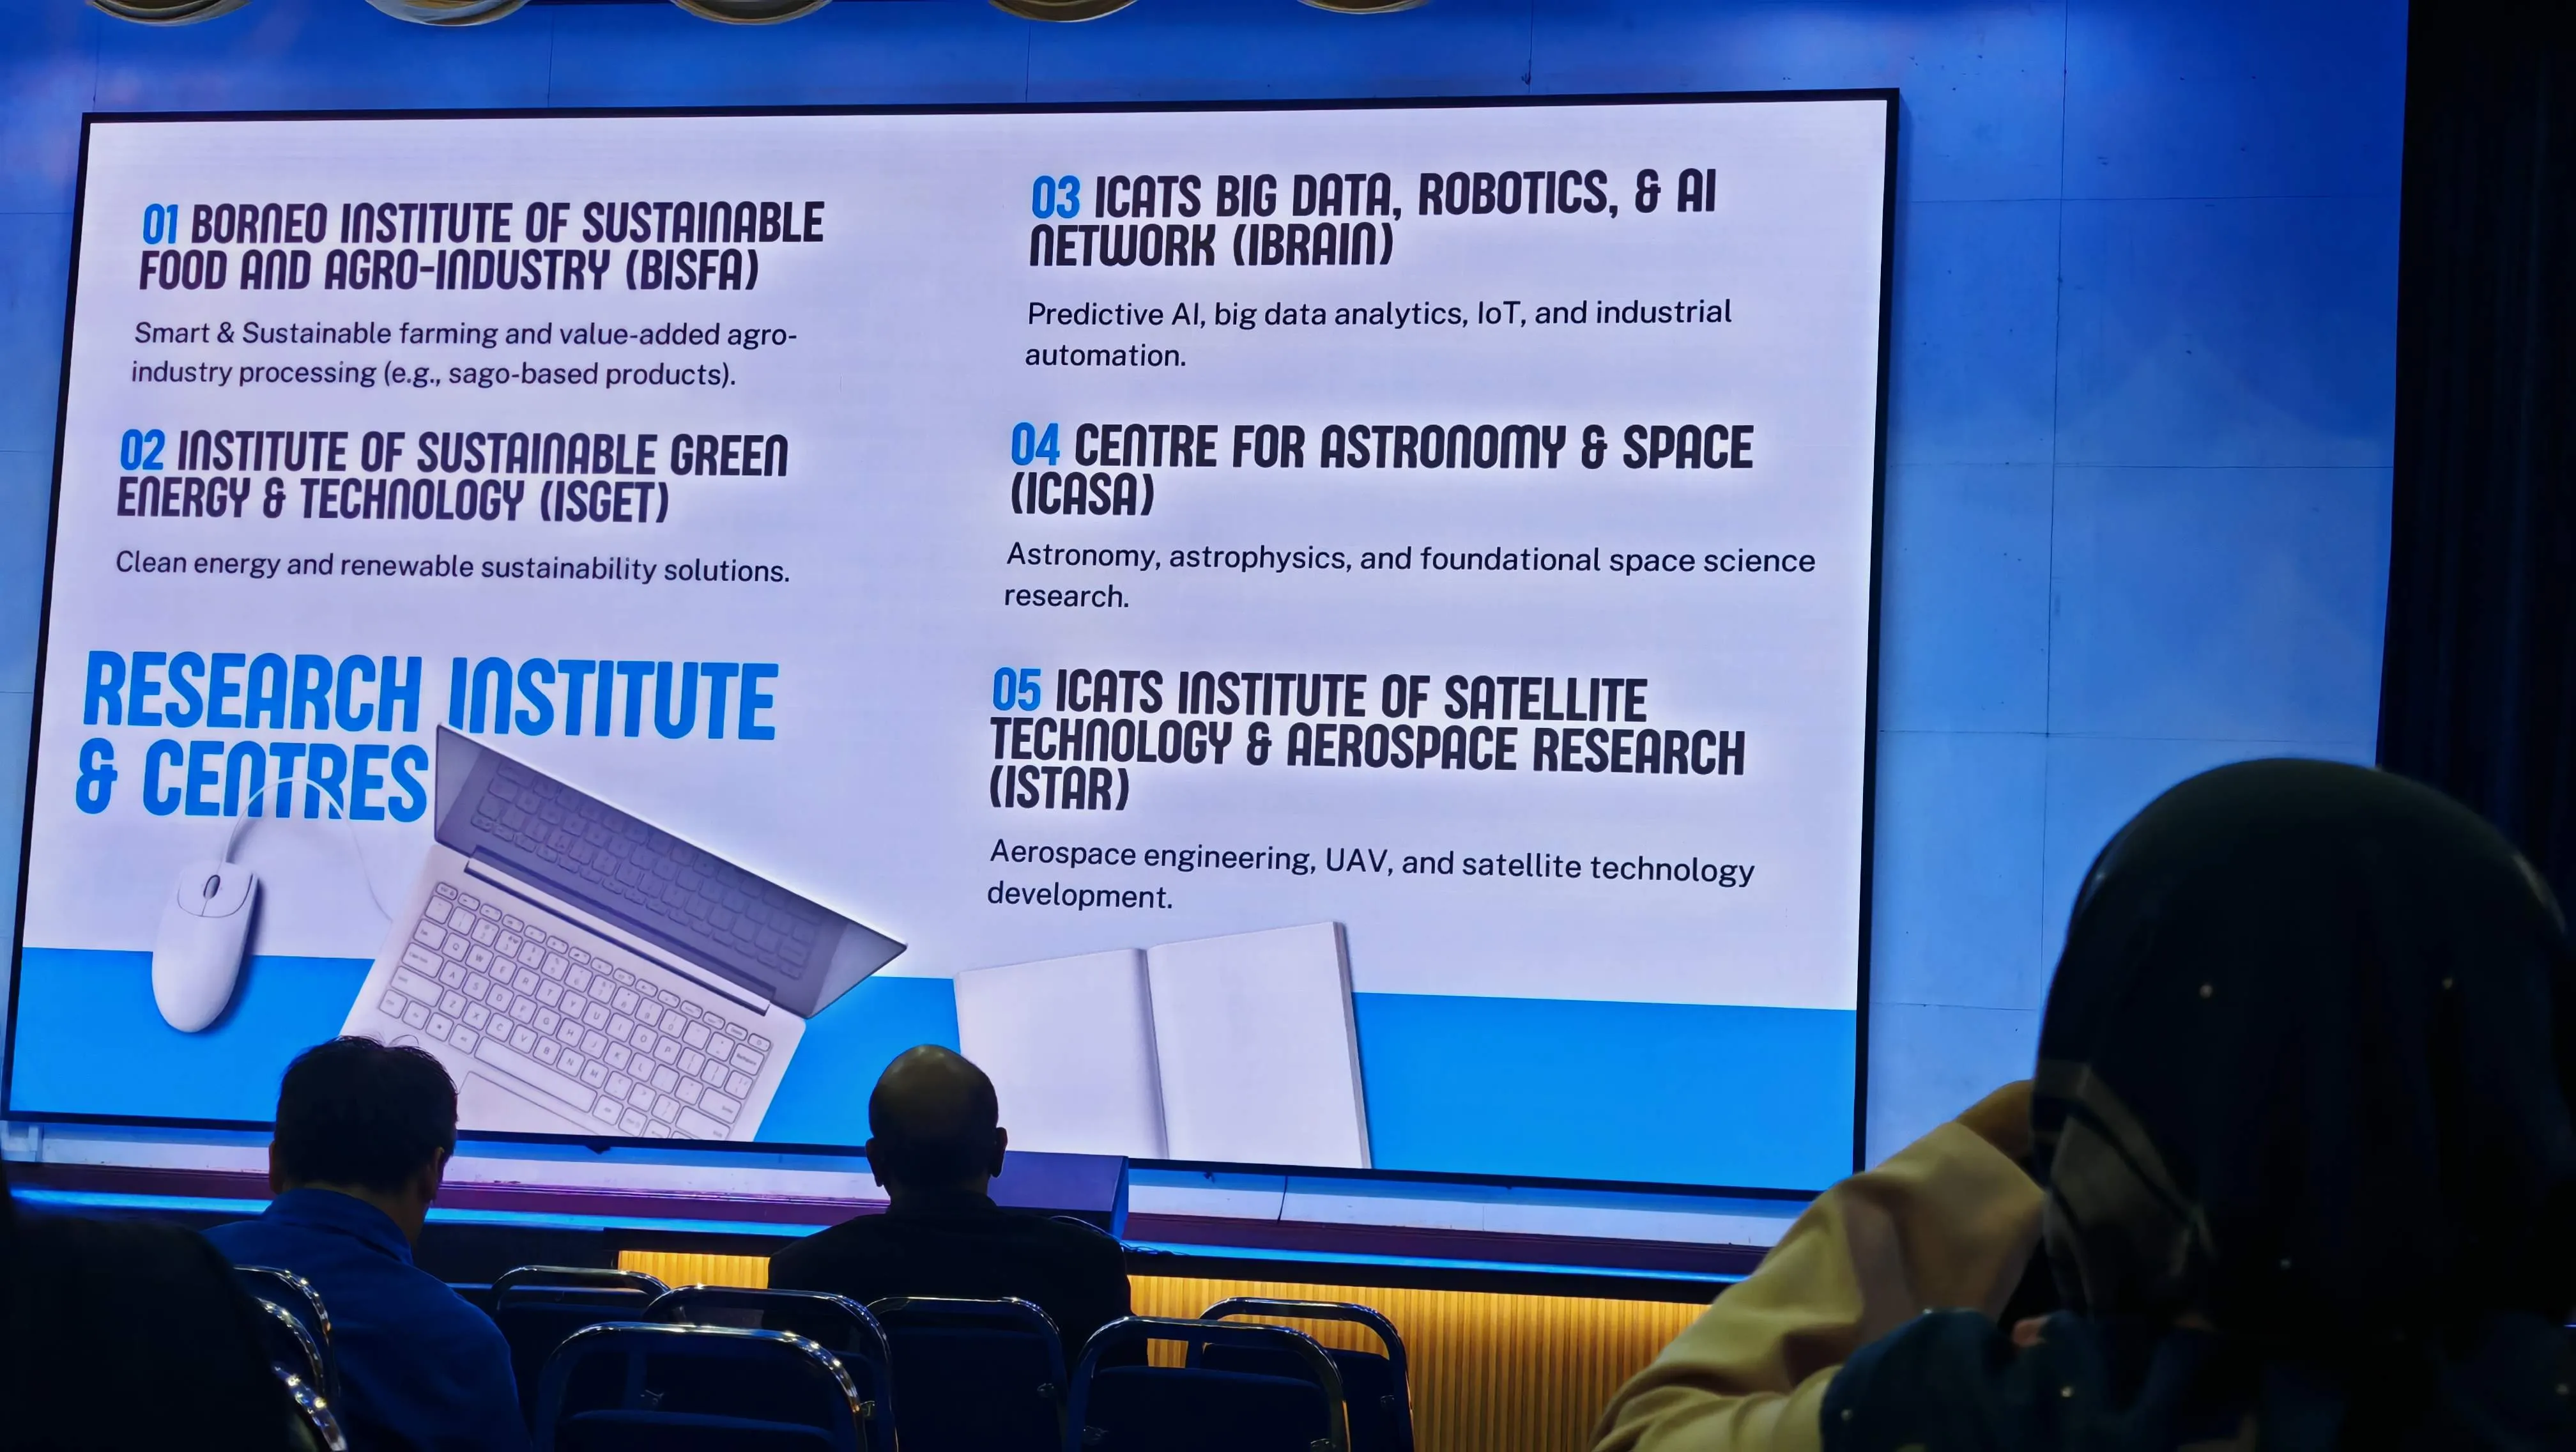
According to the master plans detailed at the summit, these systems align directly with specialized centers of tech excellence, including:
- iBRAIN: The i-CATS Big Data, Robotics, & AI Network.
- iSGET: The Institute of Sustainable Green Energy & Technology.
- iSTAR: The Institute of Satellite Technology & Aerospace Research.
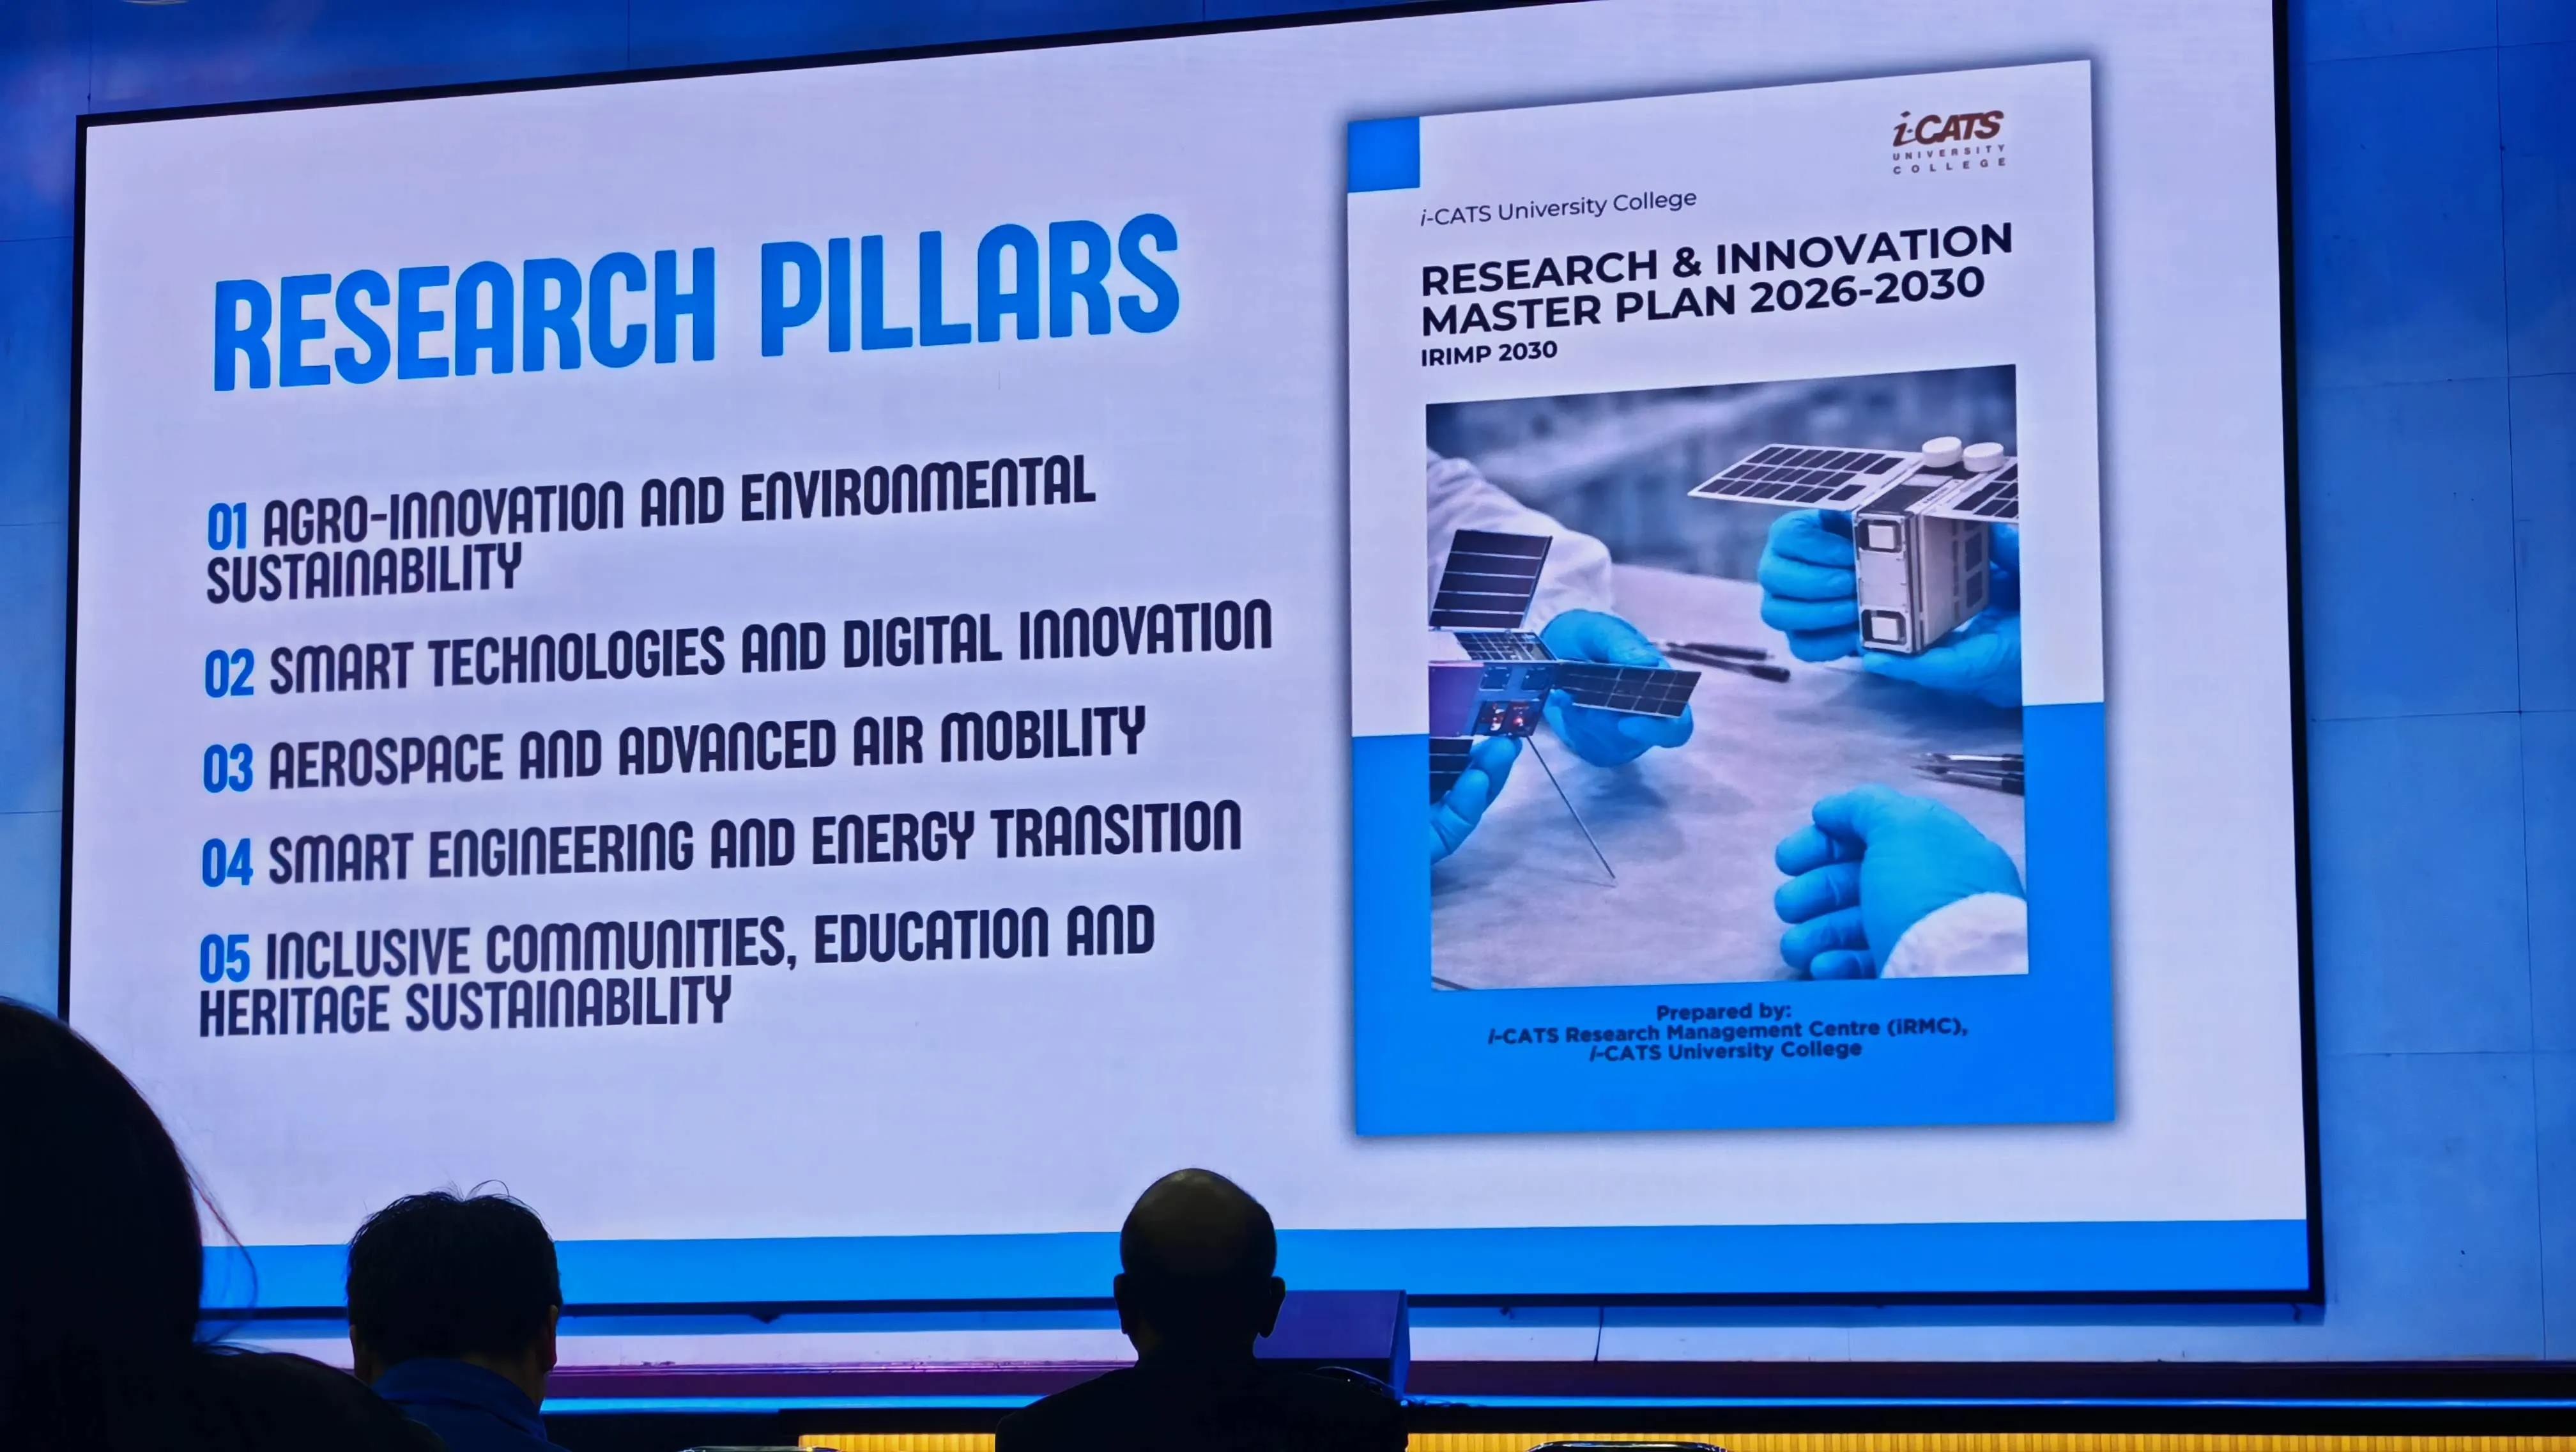
By designing your enterprise software layers to link natively with these research frameworks—including the i-CATS Research & Innovation Master Plan (2026–2030)—your technology infrastructure gains major long-term value, making it highly attractive to corporate partners, enterprise clients, and institutional investors.
Engineering Conclusion: Turning Complex Logic into High-Velocity Assets
The engineering breakthroughs showcased at URIIS 2026 confirm that high-performance digital automation is no longer optional—it is a core requirement for modern industrial software.
While basic software frameworks are fine for simple CRUD database applications, processing complex geospatial mapping vectors, automated drone imagery, and real-time IoT hardware signals demands hardware-optimized engineering.
By designing your platform architecture with compiled model runtimes, specialized time-series databases, and low-latency edge messaging layers, your company turns complex data into a highly resilient commercial asset.
If your company’s digital platforms are struggling with processing lags, scaling issues, or weak hardware integration layers, your technical architecture is leaving money on the table. Reach out to our systems engineering team to secure an in-depth infrastructure audit.
- Explore Our Core System Frameworks: Evaluate our software logic layers at /software/.
- Analyze Our Secure Integration Schemas: View our API connectivity solutions over at /integration/.
Suggested Astro Component Widget: TelemetryValidator.astro
To guarantee ultra-fast initial page load speeds and maximize your site’s Performance score, this interactive simulation component runs entirely on standard client-side vanilla JavaScript. It uses non-blocking animation frames to keep the main browser thread completely quiet during page tracking tests.
---
// TelemetryValidator.astro
// Highly scannable UI component designed for seamless styling integration
---

<div class="p-6 bg-slate-900 text-white rounded-xl shadow-2xl border border-slate-800">
  <h3 class="text-xl font-bold mb-4 text-[#00ffcc]">Edge Telemetry & ML Performance Optimizer</h3>
  <p class="text-xs text-slate-400 mb-6">
    Fine-tune machine learning confidence filters and image processing parameters to optimize frame latency and
    prediction accuracy metrics in real time.
  </p>

  <div class="grid grid-cols-1 md:grid-cols-2 gap-6">
    <!-- Input Panel -->
    <div class="space-y-4">
      <div>
        <label class="block text-xs font-semibold uppercase tracking-wider text-slate-400 mb-1"
          >Model Inference Precision Target</label
        >
        <select
          id="modelFormat"
          class="w-full p-2.5 bg-slate-800 border border-slate-700 rounded text-sm text-white focus:outline-none focus:border-[#00ffcc]"
        >
          <option value="int8">Compiled INT8 Quantized (Edge Optimized)</option>
          <option value="fp16">Compiled FP16 Floating Point (Standard Matrix)</option>
          <option value="fp32">Unoptimized FP32 Core Weights (Heavy Compute)</option>
        </select>
      </div>

      <div>
        <label class="block text-xs font-semibold uppercase tracking-wider text-slate-400 mb-1"
          >Model Confidence Filter Threshold</label
        >
        <div class="flex items-center space-x-4">
          <input
            type="range"
            id="confidenceSlider"
            min="50"
            max="95"
            value="75"
            class="w-full accent-[#00ffcc] bg-slate-800"
          />
          <span id="confidenceLabel" class="font-mono text-sm font-bold text-slate-300 w-12 text-right">0.75</span>
        </div>
      </div>

      <div>
        <label class="block text-xs font-semibold uppercase tracking-wider text-slate-400 mb-1"
          >Parallel Worker Processes</label
        >
        <div class="flex items-center space-x-4">
          <input
            type="range"
            id="workerSlider"
            min="1"
            max="8"
            value="4"
            class="w-full accent-[#00ffcc] bg-slate-800"
          />
          <span id="workerLabel" class="font-mono text-sm font-bold text-slate-300 w-12 text-right">4 Cores</span>
        </div>
      </div>
    </div>

    <!-- Output Panel -->
    <div class="p-4 bg-slate-950 rounded-lg border border-slate-800 grid grid-cols-2 gap-4">
      <div class="p-3 bg-slate-900 border border-slate-800 rounded">
        <span class="text-[10px] font-semibold uppercase tracking-wider text-slate-500 block mb-1"
          >Calculated Precision</span
        >
        <div class="text-2xl font-mono font-bold text-[#00ffcc]" id="precisionOutput">0.92</div>
      </div>

      <div class="p-3 bg-slate-900 border border-slate-800 rounded">
        <span class="text-[10px] font-semibold uppercase tracking-wider text-slate-500 block mb-1"
          >Calculated Recall</span
        >
        <div class="text-2xl font-mono font-bold text-[#00ffcc]" id="recallOutput">0.89</div>
      </div>

      <div class="p-3 bg-slate-900 border border-slate-800 rounded">
        <span class="text-[10px] font-semibold uppercase tracking-wider text-slate-500 block mb-1"
          >F1-Score Validation</span
        >
        <div class="text-2xl font-mono font-bold text-white" id="f1Output">0.90</div>
      </div>

      <div class="p-3 bg-slate-900 border border-slate-800 rounded">
        <span class="text-[10px] font-semibold uppercase tracking-wider text-slate-500 block mb-1"
          >Inference Latency</span
        >
        <div class="text-2xl font-mono font-bold text-emerald-400" id="latencyOutput">14 ms</div>
      </div>

      <div class="col-span-2 pt-2 border-t border-slate-800 flex justify-between items-center">
        <span class="text-[11px] text-slate-400 font-medium">Pipeline Status:</span>
        <div
          id="statusBadge"
          class="inline-flex items-center text-[10px] font-bold bg-emerald-950 text-emerald-400 px-2.5 py-1 rounded-full"
        >
          OPTIMIZED PIPELINE
        </div>
      </div>
    </div>
  </div>
</div>

<script>
  function calculateTelemetryMetrics() {
    const format = (document.getElementById('modelFormat') as HTMLSelectElement).value;
    const confidence = parseInt((document.getElementById('confidenceSlider') as HTMLInputElement).value) / 100;
    const workers = parseInt((document.getElementById('workerSlider') as HTMLInputElement).value);

    // Update slider UI labels immediately
    const confidenceLabel = document.getElementById('confidenceLabel');
    const workerLabel = document.getElementById('workerLabel');
    if (confidenceLabel) confidenceLabel.textContent = confidence.toFixed(2);
    if (workerLabel) workerLabel.textContent = `${workers} Core${workers > 1 ? 's' : ''}`;

    // Base performance variables matching the summit slides
    let basePrecision = 0.92;
    let baseRecall = 0.89;
    let baseLatency = 24; // milliseconds

    // Adjust metrics based on model selection configurations
    if (format === 'int8') {
      baseLatency = 14;
      basePrecision -= 0.01;
      baseRecall -= 0.01;
    } else if (format === 'fp32') {
      baseLatency = 58;
      basePrecision += 0.01;
      baseRecall += 0.02;
    }

    // Process adjustments for slider threshold variations
    const confidenceOffset = confidence - 0.75;
    basePrecision += confidenceOffset * 0.15;
    baseRecall -= confidenceOffset * 0.25;

    // Apply compute changes from processing core counts
    baseLatency = Math.max(4, baseLatency / (workers * 0.65));

    // Safeguard metrics boundaries
    basePrecision = Math.min(0.99, Math.max(0.6, basePrecision));
    baseRecall = Math.min(0.99, Math.max(0.5, baseRecall));
    let f1Score = (2 * basePrecision * baseRecall) / (basePrecision + baseRecall);

    // Update UI elements with processed calculation values
    const precisionOutputNode = document.getElementById('precisionOutput');
    const recallOutputNode = document.getElementById('recallOutput');
    const f1OutputNode = document.getElementById('f1Output');
    const latencyOutputNode = document.getElementById('latencyOutput');
    const statusBadgeNode = document.getElementById('statusBadge');

    if (precisionOutputNode) precisionOutputNode.textContent = basePrecision.toFixed(2);
    if (recallOutputNode) recallOutputNode.textContent = baseRecall.toFixed(2);
    if (f1OutputNode) f1OutputNode.textContent = f1Score.toFixed(2);
    if (latencyOutputNode) latencyOutputNode.textContent = `${Math.round(baseLatency)} ms`;

    if (statusBadgeNode) {
      if (baseLatency > 40) {
        statusBadgeNode.className =
          'inline-flex items-center text-[10px] font-bold bg-rose-950 text-rose-400 px-2.5 py-1 rounded-full';
        statusBadgeNode.textContent = 'LATENCY CRITICAL CORDS';
      } else if (f1Score < 0.82) {
        statusBadgeNode.className =
          'inline-flex items-center text-[10px] font-bold bg-amber-950 text-amber-400 px-2.5 py-1 rounded-full';
        statusBadgeNode.textContent = 'ACCURACY ACCELERATED DROP';
      } else {
        statusBadgeNode.className =
          'inline-flex items-center text-[10px] font-bold bg-emerald-950 text-emerald-400 px-2.5 py-1 rounded-full';
        statusBadgeNode.textContent = 'OPTIMIZED PIPELINE';
      }
    }
  }

  function initTelemetryListeners() {
    ['modelFormat', 'confidenceSlider', 'workerSlider'].forEach((id) => {
      const element = document.getElementById(id);
      if (element) element.addEventListener('change', calculateTelemetryMetrics);
    });

    // Provide real-time UI calculation changes during drag inputs
    ['confidenceSlider', 'workerSlider'].forEach((id) => {
      const element = document.getElementById(id);
      if (element) element.addEventListener('input', calculateTelemetryMetrics);
    });
  }

  if (document.readyState === 'complete') {
    initTelemetryListeners();
  } else {
    window.addEventListener('load', initTelemetryListeners);
  }
</script>- Computer Vision
- IoT Telemetry
- Big Data Engineering
- Edge Computing